> For the complete documentation index, see [llms.txt](https://help.foreverfanmusic.com/llms.txt). Markdown versions of documentation pages are available by appending `.md` to page URLs; this page is available as [Markdown](https://help.foreverfanmusic.com/analytics/link-and-mini-site-analytics.md).
# Link and Mini-Site Analytics
The views, clicks, locations, and sources you see on any link or your mini-site.
Every link and your mini-site has its own analytics page. It is the same set of reports in both places, so once you know how to read one you know how to read them all. Open a link or your mini-site to find it.
## The numbers at the top
Up top is a quick glance with three tiles:
* **Views**: how many times the page was loaded.
* **Clicks**: how many times fans tapped something on it.
* **CTR**: your click-through rate, which is clicks divided by views. It tells you what share of the people who saw the page actually did something on it.
## Clicks and views over time
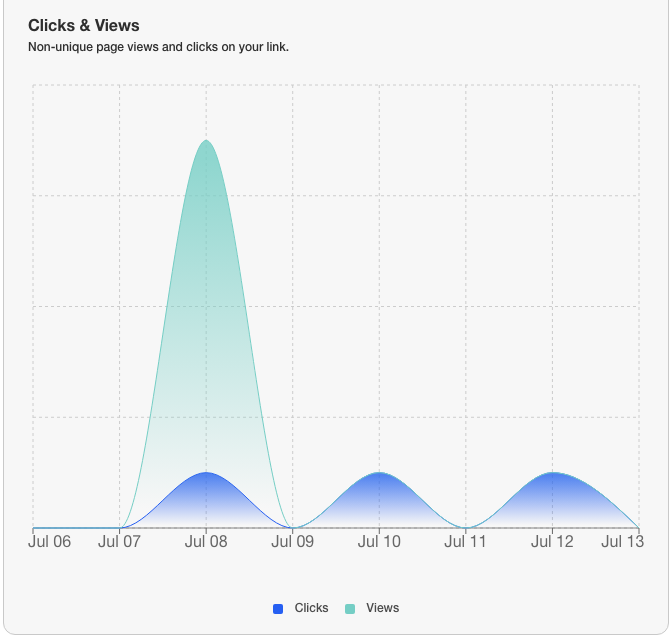
Below that is a chart plotting clicks and views together across the range you picked, so you can see the spikes: the day you posted, the day an ad went out, the day a song landed. These counts are non-unique, so one very active fan can show up more than once.
## Where your visitors are
Two reports tell you where fans are opening your page from:
* **Locations**: a world map shading the countries your viewers come from.
* **Top Cities**: the specific cities, ranked, each with its country flag.
This is worth a look before you plan a tour, a regional post, or where to spend on ads.
## Where they came from
**Source** lists the sites fans came to your link from, ranked. When a fan arrives from Instagram, a Google search, or somewhere else and that information is available, it shows up here. It is not always available, since it depends on the fan's browser and device, so treat it as a strong hint rather than a full count.
## What they clicked
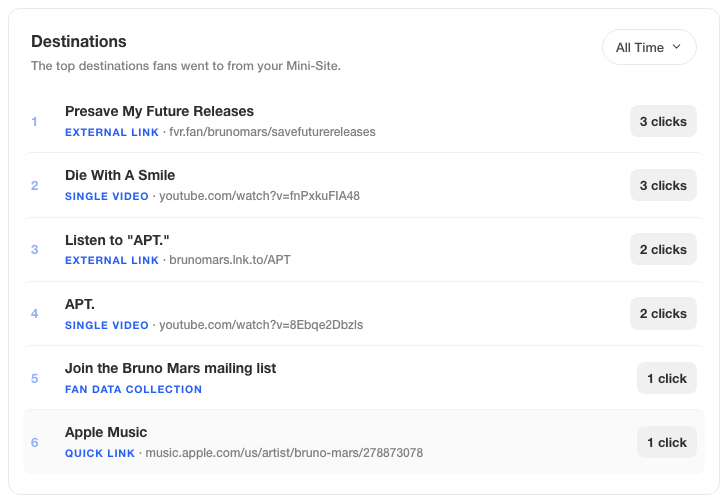
**Destinations** shows the top places fans went after they landed, so you can see what is actually pulling taps. On a streaming link, for example, this is where you see which services fans are choosing.
## Change the time range
These reports have their own time range selector, separate from your dashboard. It runs from the last 7 days out to all time, with steps in between (Last 7 Days, Last 28 Days, Last 3 Months, Last 12 Months, and All Time), so you can zoom in on a launch week or step back and see the whole life of the link.
## More on each link's page
Some link types show extra numbers that only make sense for that type, like votes on a poll or a signup funnel on a funnel link. Those live on the link's own page. See [Link analytics](/links/link-analytics.md).